Decoded. MLOps in Plain English #2 Data Lifecycle
In the previous post, the first post of this series, titled “Decoded. MLOps in Plain English #1”, I introduced the concept of MLOps and how it’s different from simply training your models in a notebook. We also dove deeper into scoping, the first step in the MLOps lifecycle. If you’re interested in reading it, you can find it in the “MLOps series” here on this blog.
Data? Have you ever heard of Kaggle? Why do I have to worry about it?
While Kaggle and other fantastic websites are a popular starting point for newcomers seeking data to experiment with and train ML models, it’s also crucial for researchers building new, state-of-the-art architectures to train and measure their performance on known benchmarks.
However…
The odds that you find the data you need to train a model to solve a particular problem is low. In this post, I touch briefly, but won’t go into much details on how to obtain data, but rather we will discuss how data is the cornerstone of the MLOps process.
Quick Comparison
Before we move on I’d like to make a quick comparison between Data in Academic/Research and Production.
CHANGE
The academic community emphasizes the immutability of datasets. One example is the famous MNIST benchmark, which stays constant with 60,000 training and 10,000 testing images. This unchanging nature is critical for reproducibility, allowing new research to build upon and compare with previous findings. On the other hand, data used in production is always evolving to improve the performance of the system and to solve some common problems we encounter.
SPECIFICITY
Data created for academic research can only be used for a particular kind of research. For example, take the famous CIFAR-10 or CIFAR-100. It was created as an image classification benchmark. If you wanted to develop a model for object detection you would need to use a different dataset to work with. In production, you’re able to use any data as long as it fits your business needs.
USABILITY
Researchers benefit from pre-cleaned datasets that allow them to focus on developing new architectures, minimizing the need for extensive data cleaning efforts. However, in production, carefully ensuring data cleanliness and consistency is essential for training high-performance systems, after all garbage in garbage out!
PROPERTIES
Any benchmark or dataset is always accompanied with something called a data card. Think of it like a label explaining the data in detail. It tells you everything you need to know about the dataset and this information stays the same, just like the static data itself. However, in production, the properties of your data change and evolve throughout the life of project itself.
Here’s a simple table to summarize the differences…
| ACADEMIC/RESEARCH | PRODUCTION | |
|---|---|---|
| CHANGE | static | dynamic |
| SPECIFICITY | more specific | more general |
| USABILITY | ready to be used | needs preprocessing, cleaning and engineering |
| PROPERTIES | defined and specifc | evolves with the project |
Scoping is complete.. Now what?
After you’ve clearly identified the business need and the problem your system is supposed to solve, you need data!
But what data?
Before you start thinking about anything else, you need to identify the data you need!
Data Definition
It’s crucial to understand your business challenge. Can you frame it as a supervised learning problem? What kind of data is needed? Images, audio, spreadsheets, or something else? Basically, we need to translate our business needs into problems solvable using data.
Ask yourself the following questions:
-
What exactly is your input?
Is it some statistics on users behaviour on a certain website? or an image taken by a robot in a factory?
-
What exactly is your output? does it solve your business need directly or is it expected to solve it?
suppose you’re trying to increase customer engagement by building a robust recommender system. In this case, a good recommendation will likely result in users staying more on the website to look at products. That’s contrary to a system used to predict the value of a stock.
Data Quality
Is the center of machine learning. Just like a strong foundation is crucial for a building, high-quality data is essential for building robust and accurate ML models. No matter what is your problem, messy or inaccurate data hinders your models’ ability to learn and improve, leading to unreliable results. Think of it like trying to build a puzzle with missing pieces; it’s impossible to get the complete picture. To ensure success, careful cleaning and accurate labeling are key, allowing your models to shine and unlock their full potential
High quality data has the following properties:
-
appropriate size.
-
good enough input coverage.
-
high degree of consistency.
Coverage and Consistency
COVERAGE
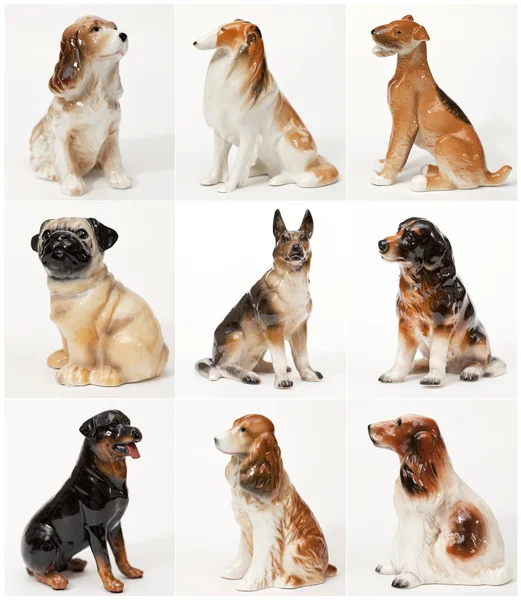
High data coverage ensures your model can handle the broad spectrum of possibilities users might throw its way. Imagine training a dog classifier on images of one dog breed only. While it might excel at identifying them, encounters with other breeds could leave it confused and unsure. Data with high coverage diversifies the training set, allowing the model to generalize and confidently navigate the diverse world of dogs (or whatever data you’re dealing with)
CONSISTENCY
there’re two types of consistency we need to think of.
-
X to y consistency
Imagine training your model on structured data where two examples are nearly identical, only differing by a tiny value (e.g. 0.01) in their features’ values, yet they have opposite labels (1 and 0). This inconsistency can confuse the model, making it difficult to learn the true relationship between the features and the label. Think of it like trying to learn traffic rules where cars with almost identical speeds face different penalties. It’s hard to grasp the underlying logic, isn’t it?
-
y consistency
to better illustrate this kind of problem, look at the picture below.

an image of the road Suppose you’re trying to build a model for vehicle detection, how would you annotate this picture?
will you do it like this?

labeling method #1 or like this?

labeling method #2 while both cases could be equally good, if you try to feed the model with examples of both of them you’re only going to confuse it! You need to pick one convention and stick to it. If you’re not the one labeling your data, you must provide clear labeling instructions to the labelers.
Big Data vs. Good Data
While it’s really important to have high quality data, sometimes you could tolerate some mislabeled and unclean data. Before you call me crazy, hear me out :)
Big data, despite its occasional messiness, can often capture the big picture of how X influences Y because there’s just so much of it. However, with smaller datasets, cleanliness is essential to ensure they accurately reflect the underlying relationship. to make it more clear, look at the following figure
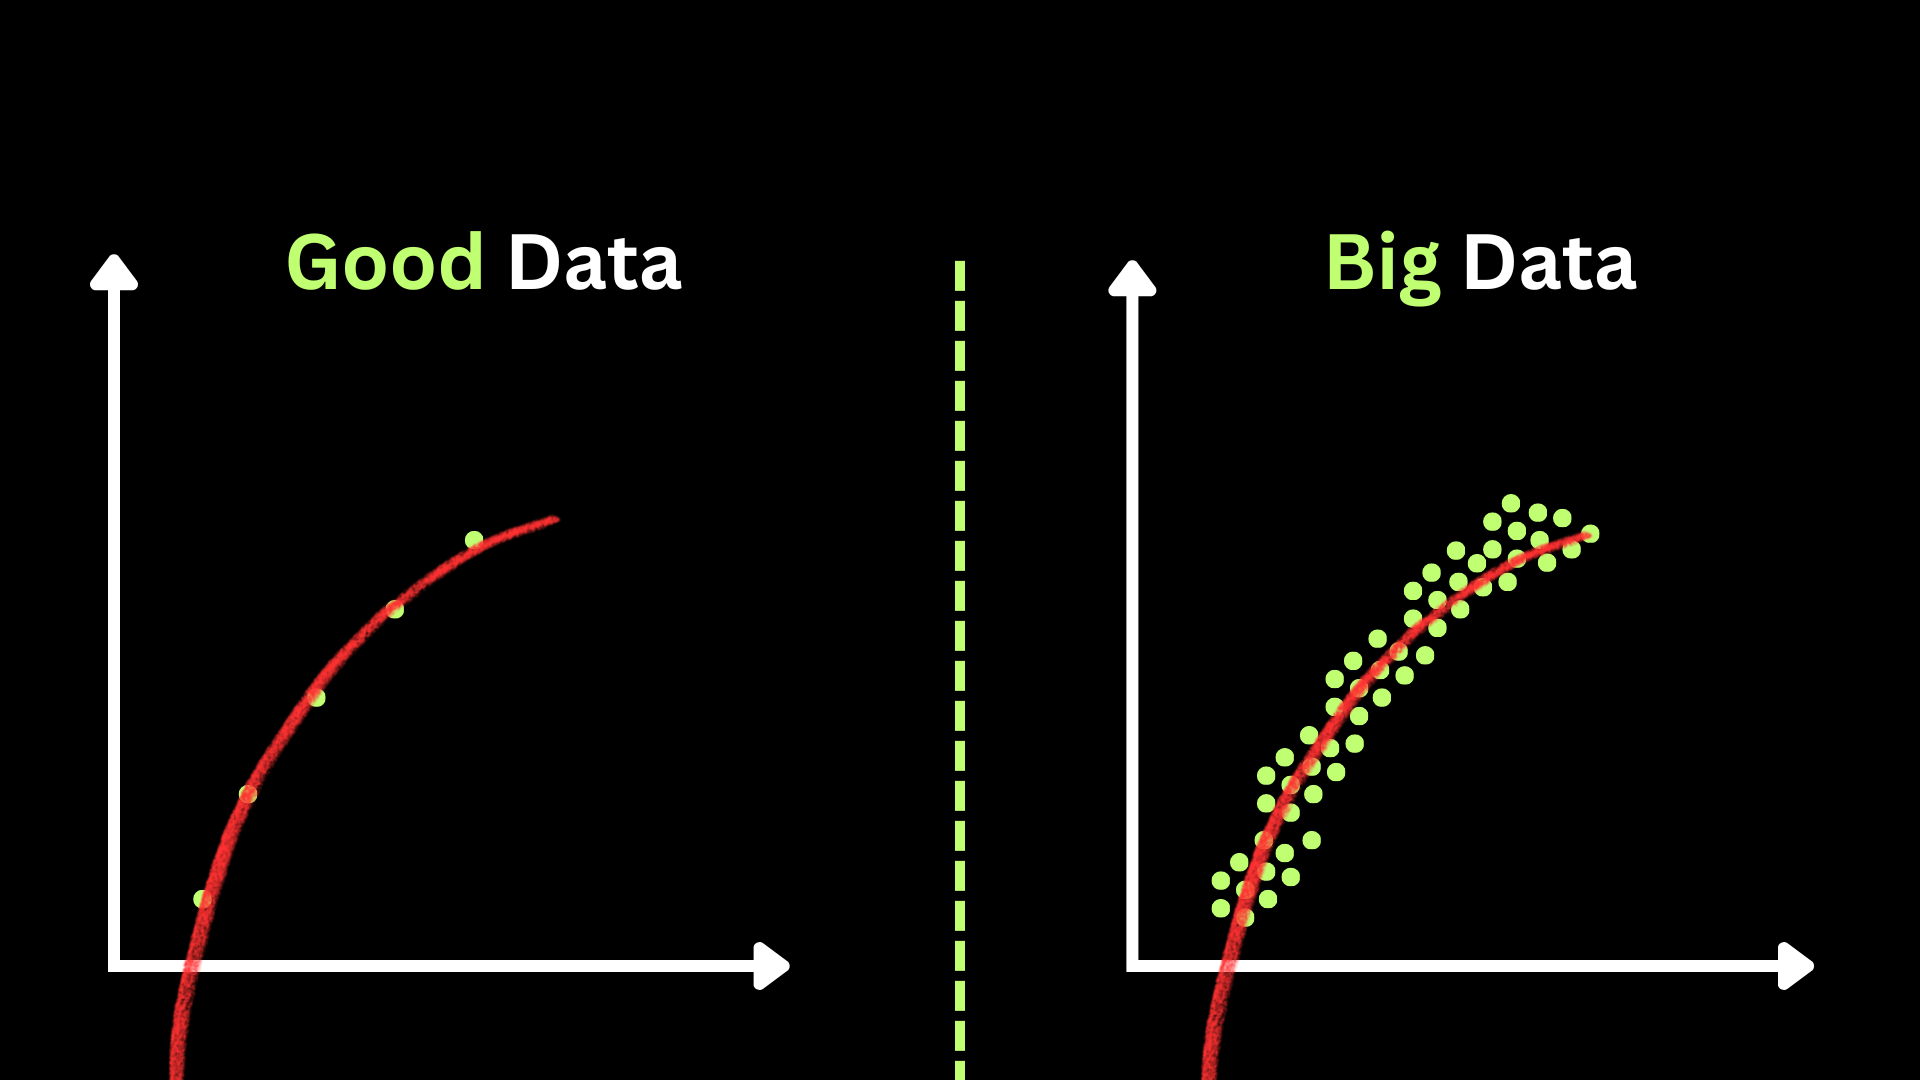
In the case of “good data”, you’re able to capture the underlying relation with only a few, high-quality examples. And in the case of “big data”, although your data is noisy, with good model architecture, you’re also able to capture the relation too!
The moral of the story,
-
if your data is big, you should focus on the overall processing of the data and not bother yourself too much with making it 100% clean.
-
consistent datasets with good coverage can reach the performance or even surpass big, inconsistent and noisy dataset.
Obtaining Data
there’s a famous saying in the MLOps world.
The data you have is rarely the data you wish you had.
When you’re thinking of how to obtain your data, it’s likely you’ll have multiple options. Because building models is a highly iterative process, you need to get your data ASAP to get in the first iteration; that’s why it’s useful to have the mindset of how can I get m examples in k days. you also need to think of the cost and the expected quality of each source, and depending on your situation, decide what data sources to invest in.
it might be useful to create a table like this:
| source | Amount | Cost | Quality | Time |
|---|---|---|---|---|
| Owned | 100k examples | $0 | medium | 0 days |
| Pay for labeling | 2m examples | $8000 | high (with rigorous labeling instructions) | 10 days |
| Purchase data | 500k examples | $1800 | medium | 1 day |
Also, while you’re iterating, sometimes you’ll need to add more training data than you already have. In that case, a good rule-of-thumb is to not increase the volume by 10 times in each iteration, since you don’t want to lose time to get in the next iteration quickly.
Data Validation
Suppose You’ve obtained the data, trained the model, and deployed it and it’s doing great! Phew! That was a lot of work, finally, we’re done! Unfortunately, this is only half of the work. When your system is in production, its performance will decay over time. Of course, it isn’t a problem in the model itself, but rather it’s the data that gets into the model from the users.
Data Drift
Although you’ve done your best to provide the best possible input coverage in your training data, it’s still impossible to account for everything! Data Drift is a change in the input distribution to the input distribution of the training data. Let’s say that you’ve trained a model to detect product defects. The factory decided to change the lighting conditions. Your model trained on images with specific lighting conditions, and using it in other conditions will have some effect on its performance.
Concept Drift
It happens when your X -> y mapping is no longer 100% true. Suppose you’re building a regression model to predict houses’ prices. During inflation, houses will probably sell for more! Your model will undervalue the prices. What happened is that the function mapping the relation has shifted toward a higher price, because of inflation.
What to do?!
To encounter these issues, what you need is to retrain your model with new data that reflects the change, so it can give high-quality output again. The frequency of retraining depends on the type of system you created and the business you’re in. For example, a speech-to-text application tends to have low-frequency retraining, as people don’t create new vocab every single day! Compare that to an app used to predict stock prices, which might need retraining multiple times a day!
Detecting drifts
Is a bit of a cumbersome task, as you need to create a Schema that captures the various statistics and properties of the data your model trained on. It also requires setting up good monitoring to detect anomalies and ways to deal with them. In the next post, we’ll dive deeper into how TFX can make our lives easier by generating a schema and validating input for anomalies!
And that’s it
In this article, we discussed the difference between data in academics and production. We touched on how to define your data for your problem and what properties define high-quality data. We Also showed that good data could perform almost equally well as big data. We touched on how to obtain data briefly and finally, we talked about data validation and the important concepts of concept and data drifts,
Let’s go!
You finished the second post of the Decoded. MLOps in Plain English! I hope you enjoyed reading it, and if you did, please consider sharing it with your friends and colleagues who might be interested in reading more about MLOps.

Thanks!
Astrodev.
